
A Personal Covid-19 Dashboard
I live in Florida where coronavirus (as of June 2020) is surging. It's hard to contextualize what that means for my family without knowing nearby case history. Most public dashboards are at the state level with only raw numbers for counties.
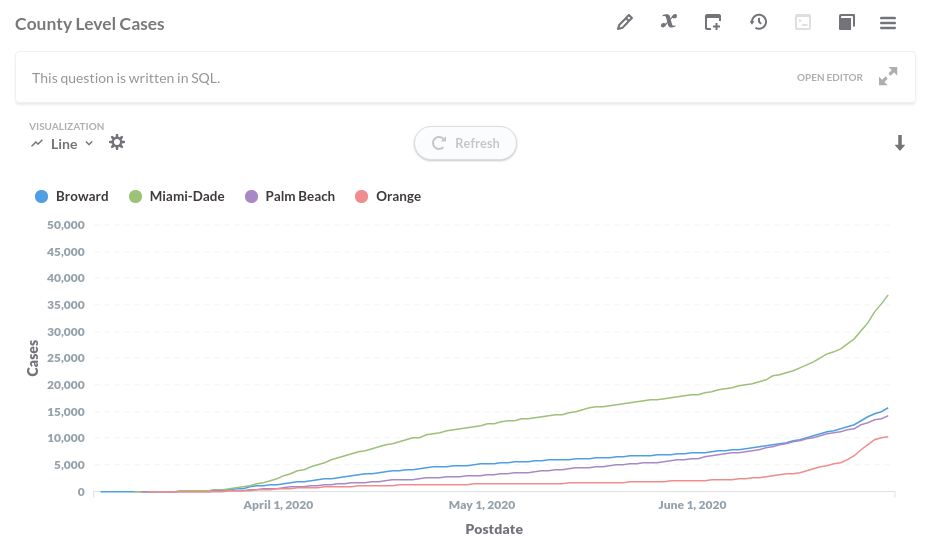
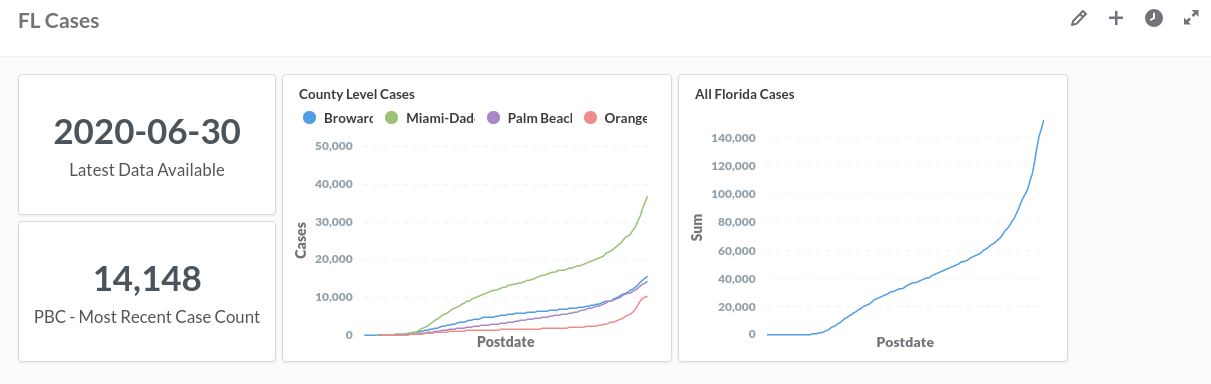
I wanted to be able to see the trend of cases in various counties over time. So I built my own dashboard:
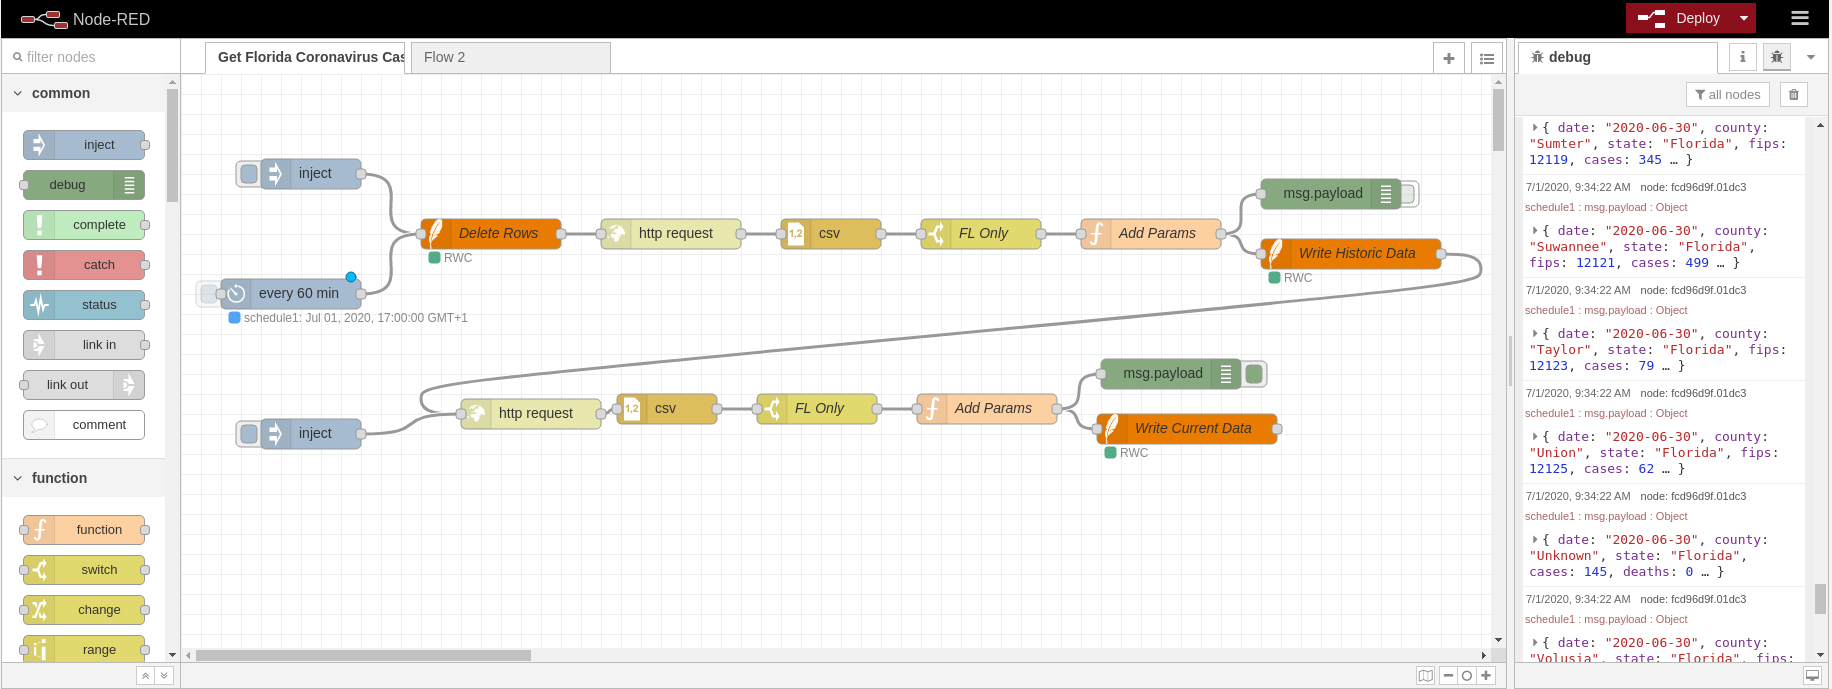
I'm using Node-RED on a Raspberry Pi (4GB) to poll the New York Times Covid-19 dataset on GitHub. They have historic county level data through the previous day, and live updates on the current day.
I'm using Node-RED to rewrite to a sqlite database every hour. The Node-RED flow deletes existing data before each run as the NYT seems to revise the live numbers throughout the day. This is likely wasteful and would be more optimized to only run the live dataset hourly, and the historic dataset every 24 hours. But this was the fastest way to build the workflow and runs automatically.
Metabase powers the dashboard. It's easy to set up but clearly not optimized for the Raspberry Pi. It takes ~3-5 min to start up on reboot.
This was relatively easy to setup (~1 hour from start) so I'm looking forward to adding to it.
Potential upgrades:
- Move from NYT data to official Florida Department of Health dataset
- Optimize the historic vs. live updates
- Migrate from Node-RED to an ELT/ETL system. Considering Meltano as an up-and-coming open source solution.
- Normalize case counts to some combination of county population, testing counts, etc
- Add hospitalizations / ICU capacity